Monitors
Translations
This tutorial is also available in the following languages:
Purpose
A monitor is an external healthcheck which is performed on your application. For now we're implementing only http healthcheck with GET, POST and PUT methods. In the future we'll have more healthchecks.
Our monitor system is able to:
- present the last check in our graphical interface
- export the result as a Prometheus/OpenMetrics gauge in the
/v1/metricsendpoint of CWCloud's API - push the metrics to an opentelemetry OTLP/grpc endpoint (configured with the
OTEL_COLLECTOR_ENDPOINTenvironment variables, see the selfhosted documentation for that).
Demo
Here's a 10 min demo that will show you how to use our monitor management system:
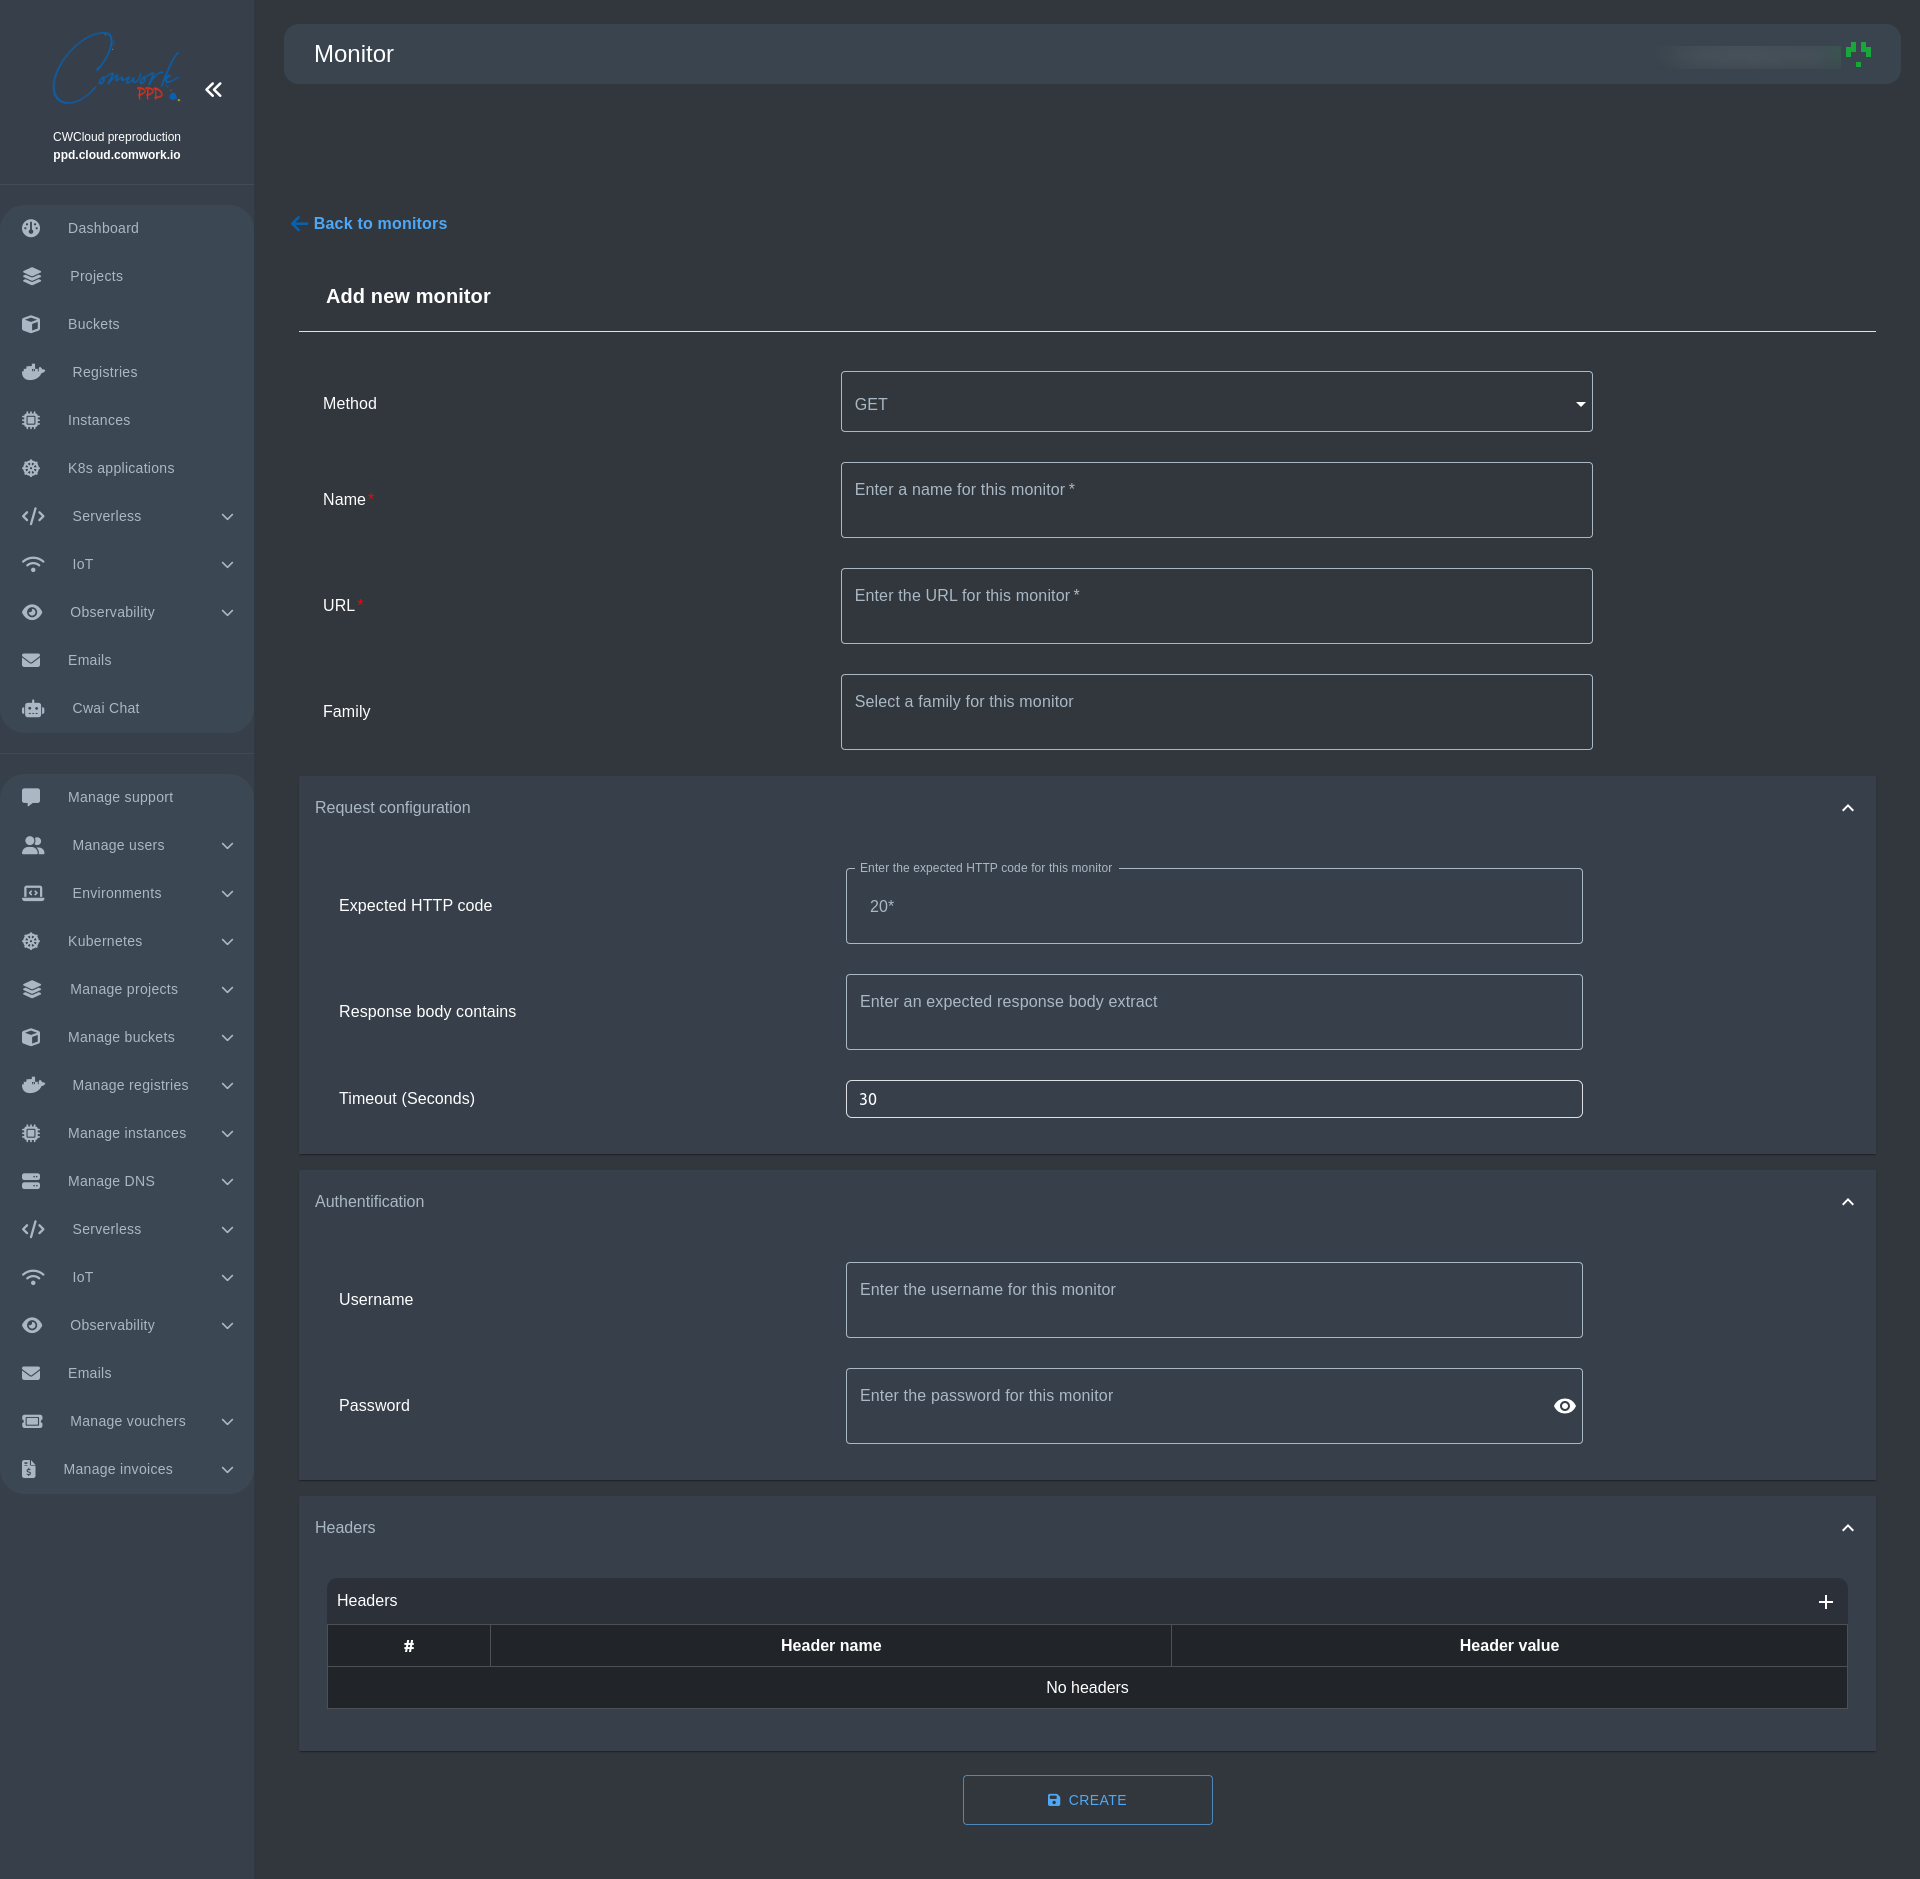
Creating a monitor
Observability > Monitor

Notes:
- For the expected http code, you can use the
*meta caracter which is evaluated as any number. For example if you set20*, the monitor will be "success" with every http code starting by20like200,201,202... - The
response body containwill make the monitor fail if the response body doesn't contain the value - You can setup a basic authentication and custom headers
- For the
POSTandPUTmethods you can configure the request's body - You can also use the cli to create monitors, see this documentation
Indexing Prometheus metrics into Quickwit
- In order to install Quickwit via CWCloud, go read this tutorial
- In order to configure Vector and Quickwit to scrap and index the Prometheus metrics, see this blogpost
