Imalive API / metrics exporter
Let your nodes sing like Céline Dion I'm alive!.
Just a dummy healthcheck api for your nodes (support x86 and armhf for raspberrypi).
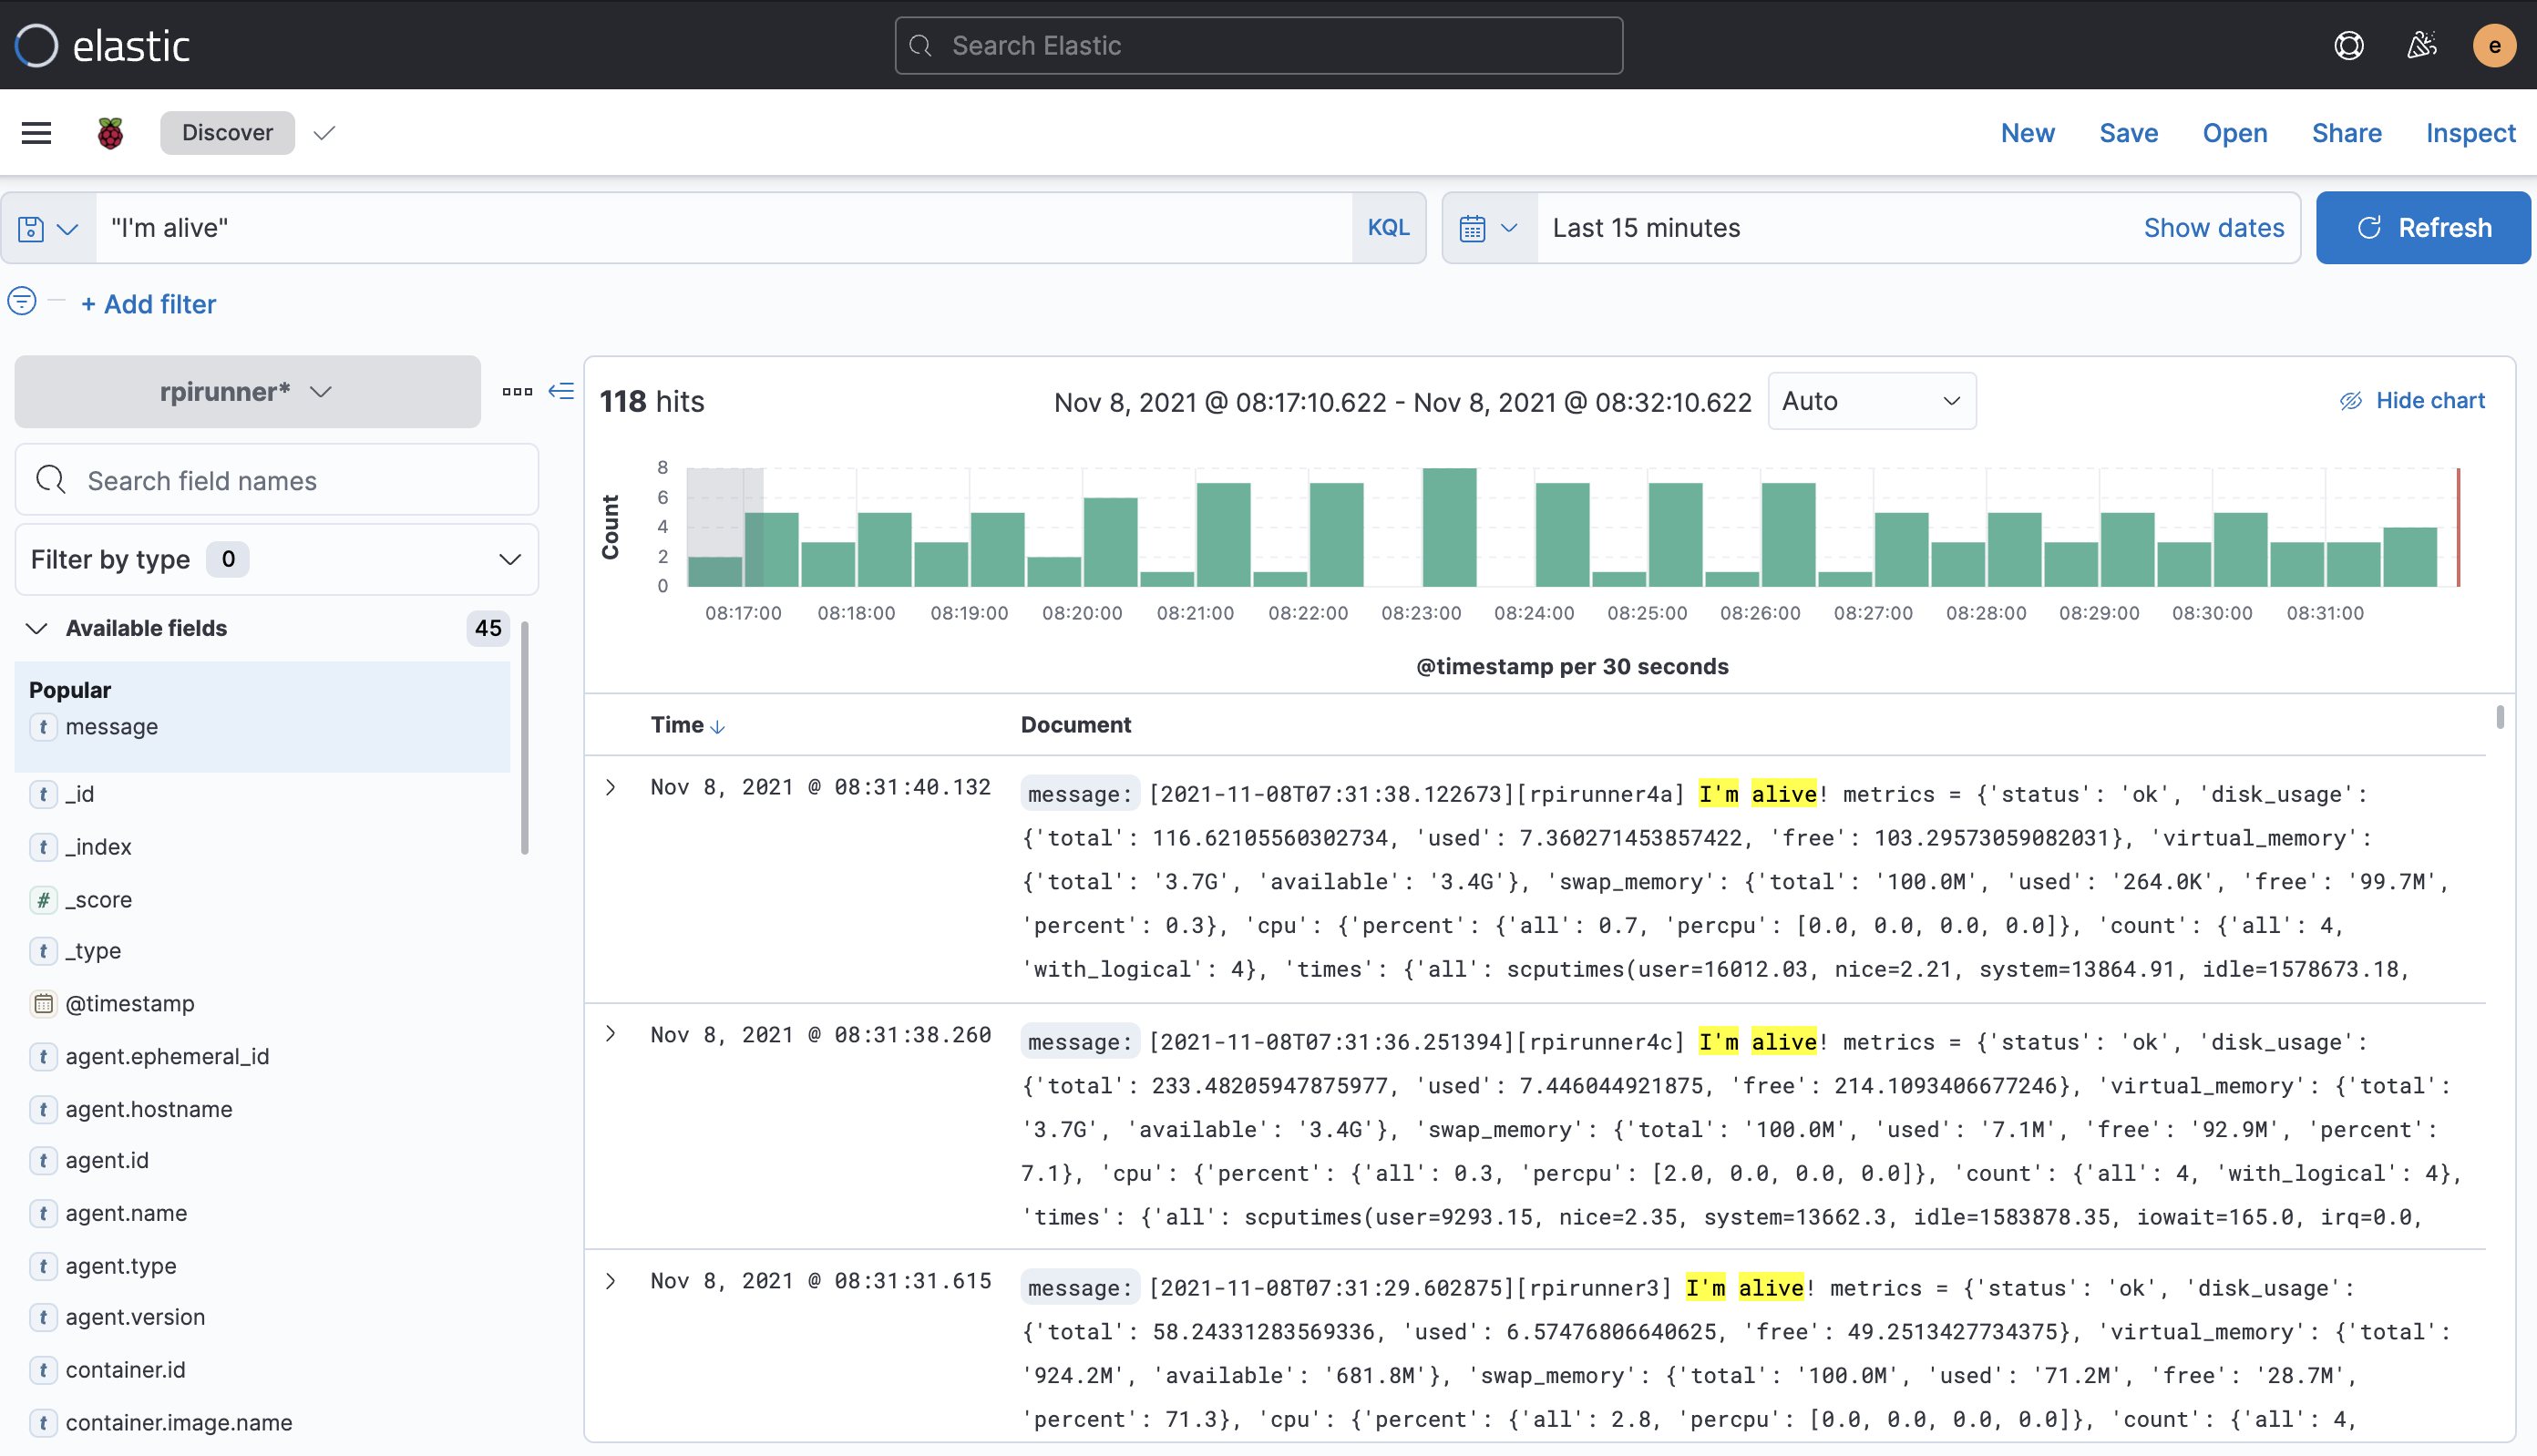
It provide a http/restful endpoint that you can use as a healthcheck rule to your loadbalancer and also publish a heartbit in stdout (usefull if you collect it in a log/alerting management system such as elasticstack).

Translations
This tutorial is also available in the following languages:
Git repositories
- Main repo: https://gitlab.comwork.io/oss/imalive
- Github mirror: https://github.com/comworkio/imalive.git
- Gitlab mirror: https://gitlab.com/ineumann/imalive.git
Image on the dockerhub
The image is available and versioned here: https://hub.docker.com/r/comworkio/imalive-api
An example of exposed API instance: https://imalive.comwork.io
Getting started
Running with ansible
Some environment like vps1 are already install the imalive role. However, even when it's not provided, you still can add this ansible role on your deployment repo and adding the role invokation in your playbook.
Running with docker-compose
Get this docker-compose file.
Then, create your .env file from the .env.example:
cp .env.example .env
Then replace the values (like the IMALIVE_NODE_NAME with your node name). Then:
docker-compose up
If you want to test on a raspberrypi or any other ARM device, use this command instead:
docker-compose -f docker-compose-arm.yml up
Running with K3D (Kubernetes / helm)
Use our helm chart here
Test with K3D (init the cluster)
k3d cluster create localdev --api-port 6550 -p "8089:80@loadbalancer"
sudo k3d kubeconfig get localdev > ~/.kube/config
Continue to the next chapter
Install the helmchart
cd helm # all the commands below must be under imalive/helm directory
kubectl create ns imalive
helm dependency update
helm -n imalive install . -f values.yaml --generate-name
Check the deployment and ingress
kubectl -n imalive get deployments
kubectl -n imalive get pods
kubectl -n imalive get svc
kubectl -n imalive get ingress
curl localhost:8089 -v
Endpoints
Healthcheck
curl localhost:8080/v1/health
{"status": "ok", "time": "2021-11-05T06:55:28.274736", "alive": true, "name": "anode"}
Manifests
curl localhost:8080/v1/manifest
{"version": "1.0", "sha": "1c7cb1f", "arch": "x86"}
Metrics
curl localhost:8080/v1/metrics
{"status": "ok", "disk_usage": {"total": 102.11687469482422, "used": 22.499202728271484, "free": 74.402099609375}, "virtual_memory": {"total": "1.9G", "available": "984.7M"}, "swap_memory": {"total": "1024.0M", "used": "493.1M", "free": "530.9M", "percent": 48.2}, "cpu": {"percent": {"all": 2.8, "percpu": [5.0, 4.0, 3.0, 2.0]}, "count": {"all": 4, "with_logical": 4}, "times": {"all": [10665.39, 7.0, 4718.91, 400345.0, 156.08, 0.0, 226.8, 0.0, 0.0, 0.0], "percpu": [[2488.92, 1.24, 1196.15, 100191.67, 38.08, 0.0, 82.3, 0.0, 0.0, 0.0], [2757.78, 1.63, 1196.16, 99992.0, 37.88, 0.0, 55.78, 0.0, 0.0, 0.0], [2704.56, 2.05, 1162.12, 100082.77, 40.01, 0.0, 47.75, 0.0, 0.0, 0.0], [2714.11, 2.06, 1164.46, 100078.54, 40.1, 0.0, 40.96, 0.0, 0.0, 0.0]]}}}
Heartbit
You can change the wait time between two heartbit with the WAIT_TIME environment variable (in seconds).
Here's an example of stdout heartbit:
[2021-11-06T14:45:33.902885][anode] I'm alive! metrics = {'status': 'ok', 'disk_usage': {'total': 102.11687469482422, 'used': 22.521244049072266, 'free': 74.38005828857422}, 'virtual_memory': {'total': '1.9G', 'available': '959.0M'}, 'swap_memory': {'total': '1024.0M', 'used': '493.1M', 'free': '530.9M', 'percent': 48.2}, 'cpu': {'percent': {'all': 3.5, 'percpu': [8.0, 5.0, 6.1, 11.0]}, 'count': {'all': 4, 'with_logical': 4}, 'times': {'all': scputimes(user=10679.53, nice=7.01, system=4727.11, idle=401080.72, iowait=156.27, irq=0.0, softirq=227.12, steal=0.0, guest=0.0, guest_nice=0.0), 'percpu': [scputimes(user=2492.49, nice=1.24, system=1198.2, idle=100375.46, iowait=38.16, irq=0.0, softirq=82.38, steal=0.0, guest=0.0, guest_nice=0.0), scputimes(user=2760.93, nice=1.64, system=1198.27, idle=100176.24, iowait=37.93, irq=0.0, softirq=55.87, steal=0.0, guest=0.0, guest_nice=0.0), scputimes(user=2708.45, nice=2.06, system=1164.18, idle=100266.4, iowait=40.04, irq=0.0, softirq=47.82, steal=0.0, guest=0.0, guest_nice=0.0), scputimes(user=2717.65, nice=2.06, system=1166.46, idle=100262.62, iowait=40.12, irq=0.0, softirq=41.03, steal=0.0, guest=0.0, guest_nice=0.0)]}}}
[2021-11-06T14:45:45.914750][anode] I'm alive! metrics = {'status': 'ok', 'disk_usage': {'total': 102.11687469482422, 'used': 22.52124786376953, 'free': 74.38005447387695}, 'virtual_memory': {'total': '1.9G', 'available': '959.8M'}, 'swap_memory': {'total': '1024.0M', 'used': '493.1M', 'free': '530.9M', 'percent': 48.2}, 'cpu': {'percent': {'all': 2.0, 'percpu': [2.0, 3.0, 2.0, 4.0]}, 'count': {'all': 4, 'with_logical': 4}, 'times': {'all': scputimes(user=10680.4, nice=7.01, system=4727.63, idle=401126.91, iowait=156.28, irq=0.0, softirq=227.13, steal=0.0, guest=0.0, guest_nice=0.0), 'percpu': [scputimes(user=2492.68, nice=1.24, system=1198.34, idle=100387.01, iowait=38.17, irq=0.0, softirq=82.38, steal=0.0, guest=0.0, guest_nice=0.0), scputimes(user=2761.19, nice=1.64, system=1198.36, idle=100187.77, iowait=37.93, irq=0.0, softirq=55.87, steal=0.0, guest=0.0, guest_nice=0.0), scputimes(user=2708.66, nice=2.06, system=1164.31, idle=100277.96, iowait=40.04, irq=0.0, softirq=47.83, steal=0.0, guest=0.0, guest_nice=0.0), scputimes(user=2717.86, nice=2.06, system=1166.61, idle=100274.16, iowait=40.12, irq=0.0, softirq=41.03, steal=0.0, guest=0.0, guest_nice=0.0)]}}}
[2021-11-06T14:45:57.924797][anode] I'm alive! metrics = {'status': 'ok', 'disk_usage': {'total': 102.11687469482422, 'used': 22.52124786376953, 'free': 74.38005447387695}, 'virtual_memory': {'total': '1.9G', 'available': '963.0M'}, 'swap_memory': {'total': '1024.0M', 'used': '493.1M', 'free': '530.9M', 'percent': 48.2}, 'cpu': {'percent': {'all': 2.5, 'percpu': [4.0, 3.0, 2.0, 4.0]}, 'count': {'all': 4, 'with_logical': 4}, 'times': {'all': scputimes(user=10681.23, nice=7.01, system=4728.14, idle=401173.13, iowait=156.28, irq=0.0, softirq=227.15, steal=0.0, guest=0.0, guest_nice=0.0), 'percpu': [scputimes(user=2492.87, nice=1.24, system=1198.47, idle=100398.59, iowait=38.17, irq=0.0, softirq=82.39, steal=0.0, guest=0.0, guest_nice=0.0), scputimes(user=2761.37, nice=1.64, system=1198.5, idle=100199.34, iowait=37.93, irq=0.0, softirq=55.88, steal=0.0, guest=0.0, guest_nice=0.0), scputimes(user=2708.91, nice=2.06, system=1164.42, idle=100289.48, iowait=40.04, irq=0.0, softirq=47.83, steal=0.0, guest=0.0, guest_nice=0.0), scputimes(user=2718.07, nice=2.06, system=1166.75, idle=100285.71, iowait=40.12, irq=0.0, softirq=41.04, steal=0.0, guest=0.0, guest_nice=0.0)]}}}
You can change anode by your node name with the IMALIVE_NODE_NAME environment variable.
You also can log only a json output by activating the HEART_BIT_LOG_JSON environment variable (with yes or true).
OpenTelemetry
You can also configure an OTLP2/grpc endpoint using the OTEL_COLLECTOR_ENDPOINT environment variable.
Here's an example of Prometheus configuration for scrapping the opentelemetry collector metrics:
global:
  scrape_interval: 10s

scrape_configs:
  - job_name: 'opentelemetry'
    static_configs:
      - targets: ['otel-collector:8889']
And the opentelemetry collector configuration as well for receiving the logs, traces and metrics from imalive:
receivers:
  otlp:
    protocols:
      grpc:
      http:

exporters:
  logging:
  prometheus:
    endpoint: "0.0.0.0:8889"
    const_labels:
      otel: otel
  otlp:
    endpoint: "jaeger:4317"
    tls:
      insecure: true

processors:
  batch:

service:
  pipelines:
    metrics:
      receivers: [otlp]
      exporters: [prometheus]
    traces:
      receivers: [otlp]
      exporters: [otlp]
    logs:
      receivers: [otlp]
      processors: [batch]
      exporters: [logging]
Monitor features
Imalive is also able to check some http endpoint and log and export metrics (status and duration).
In order to use that, just override the /app/imalive.yml with the following content:
---
monitors:
  - type: http
    name: imalive
    url: http://localhost:8081
    method: GET # optional (GET by default, only POST and GET are supported)
    expected_http_code: 200 # optional (200 by default)
    expected_contain: "\"status\":\"ok\"" # optional (no check on the body response if not present)
    timeout: 30 # optional (30 seconds if not present)
    username: changeit # optional (no basic auth if not present)
    password: changerit # optional (no basic auth if not present)
    headers: # optional (no headers if empty)
      - name: Accept
        value: application/json